H1B
The H1B visa is a non-immigrant visa that allows companies in the US to hire graduate-level workers in specialty occupations that require theoretical or technical expertise in specialized fields.
Requirements
- A bachelor’s degree.
- A job offer from a company within the United States for a specialty position that matches your degree.
Why is H1B Popular?
- For a company in the US, applying for H1B is generally quicker than applying for a US Green Card, so it is popular when companies want to bring in an employee for a longer period.
- H1B is open to nationals and citizens of any country, as opposed to other visa types that are only open to people from certain countries.
- H1B allows holders to stay for three years initially, and the stay can be easily extended for three additional years after the first term.
- H1B allows holders to move their status from one company to another and also allows its holders to work part-time and work for multiple employers at the same time.
- The main benefit of H1B that attracts a large volume of applicants is the fact that it is a dual-intent visa. This means that it allows its holders to seek permanent residency while under H1B nonimmigrant status.
Caveats
Despite having a lot of advantages, applying for the H1B comes with its own set of caveats or disadvantages.
- The biggest drawback of H1B is the fact that there is a limit on the number of petitions that are approved each year. Because of the large number of petitions each year, USCIS has chosen to have all petitions entered into a lottery. There is an annual general cap of 65,000, plus 20,000 petitions for applicants with a master’s degree or above. This means there is a strong likelihood that for any given year, your petition will not be selected. Once rejected, you will have to wait another year to submit another petition.
- Because of the H1B lottery, the deadlines for the H1B applications are very inflexible.
- It is difficult to find an employer that would be willing to sponsor an employee for H1B, as the process can get expensive and is unreliable.
H1B Historic Timeline
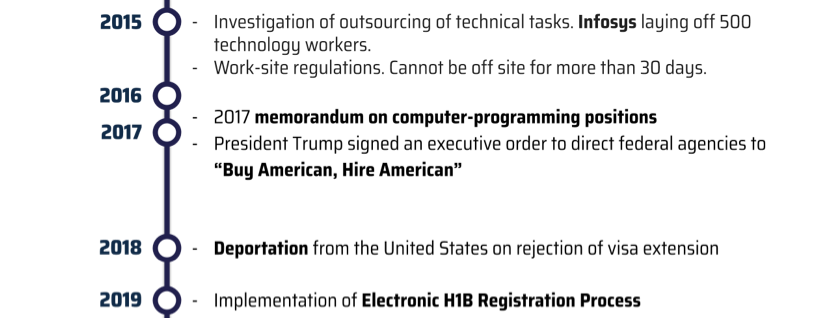 The timeline of relevant events is listed above. Sources for this information include the New York Times and official government documents from USCIS (U.S. Citizenship and Immigration Services).
Exploration
Purpose
The main purpose of our exploration was to examine trends in H1B visa applications and see how data-related jobs in the United States have changed over the past 5 years.
Dataset
To perform this analysis, we combined data sets of 5 different years from 2014 to 2018.


| Column Name | Column Description |
|---|---|
| job_title | Job title of the particular H1B application. |
| case_status | Certified-withdrawn; Certified; Denied; Withdrawn; Rejected; Invalidated. We filter this data by certified because we only wish to keep the applications that were certified. |
| employer_name | Employer through which the H1B application was submitted. |
| prevailing_wage | The annual salary of the job in a particular observation. |
| year | Year the particular H1B application was submitted. |
| worksite | Location of the worksite. |
| lon | Longitude of the worksite. |
| lat | Latitude of the worksite. |
| data_relation | If the job title is data-related, this will have “data-related”; otherwise, it will have “undefined”. |
| data_job_title | This will be used to classify the data-related job titles into 4 different categories of business analysts, data analysts, data engineers, and data scientists. |
| stem | This classifies the H1B application as STEM or non-STEM based on another dataset. |
| soc_code | SOC is a federal statistical standard used by federal agencies to classify workers into occupational categories to collect, calculate, or disseminate data. |
Number of Applications Per State
We wanted to look at how the number of applications differed per state over the course of the last 5 years. Here we can see that the states of California, Texas, New York, Michigan, Georgia, Pennsylvania, Florida, and Illinois are the states with the highest number of applications. The number of applicants is seen to increase over time (from 2015 to 2017) for Washington, Virginia and North Carolina. States that have the lowest number of applicants are Montana, Wyoming and South Dakota.
STEM
Instead of doing an overview of the full dataset, we thought it would be better to first filter by STEM (Science, Technology, Engineering, and Mathematics)-related jobs. We expected the majority of the applications to come from STEM, but confirmation was needed.
The following analysis was done to see the proportion of H1B applicants in STEM fields vs non-STEM fields. This was done using the SOC (Standard Occupational Classification) code associated with each occupation. This was then cross-referenced (left-join) with a list of SOC codes that were considered STEM. We combined this with our analysis of the total number of applicants per year to see if some trends had changed.
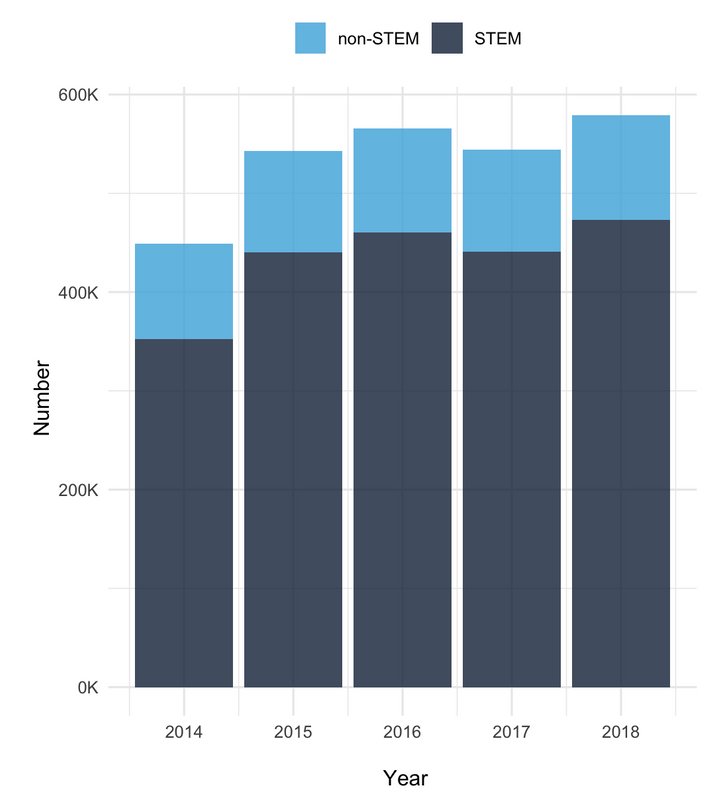
We observed (from Figure 2) that the number of applications stays high as compared to the yearly cap of 85,000 applications that get approved. The number of applications also keeps increasing each year with only a slight dip in 2017. The changes in the total number of applications don’t seem to affect the proportion of STEM to non-STEM applications each year. This is also very interesting to note as the number of non-STEM jobs available in the United States is much higher than the number of STEM jobs.
This disproportionately high number might be attributed to the fact that foreign students with STEM degrees are more likely to pursue STEM fields. The reason for this is that USCIS allows foreign students who pursue a STEM degree during their academic career to stay within the United States for up to three years after they have graduated as opposed to a single year for those of non-STEM backgrounds. This means that during those 3 years, you will have three chances to apply for an H1B and would potentially be eligible to apply for permanent residency.
Another reason why international students might want to pursue STEM would be the prevailing wages for STEM and non-STEM jobs.
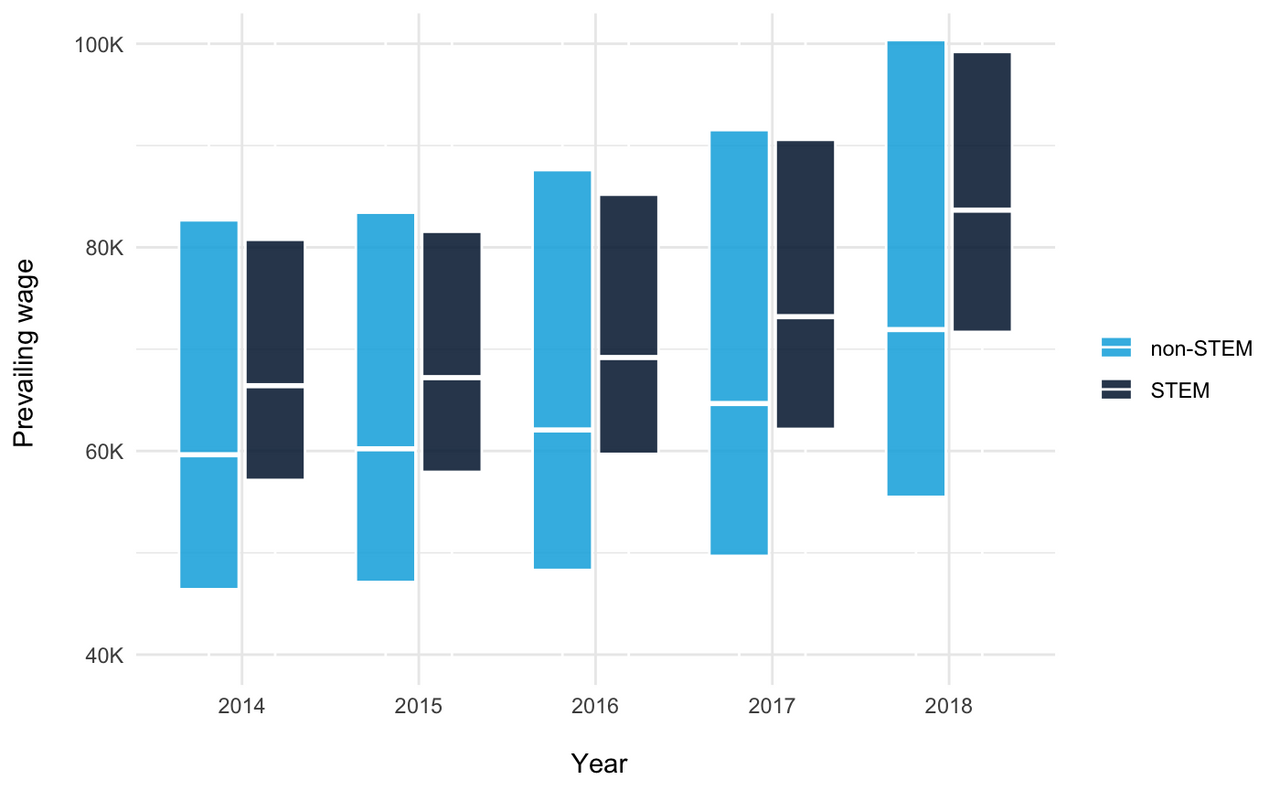
The gap between the median prevailing wages of STEM and non-STEM jobs has become wider, and the median for STEM jobs is always higher than the median for non-STEM jobs (Figure 3). In 2018, the gap between the two appears to be the widest.
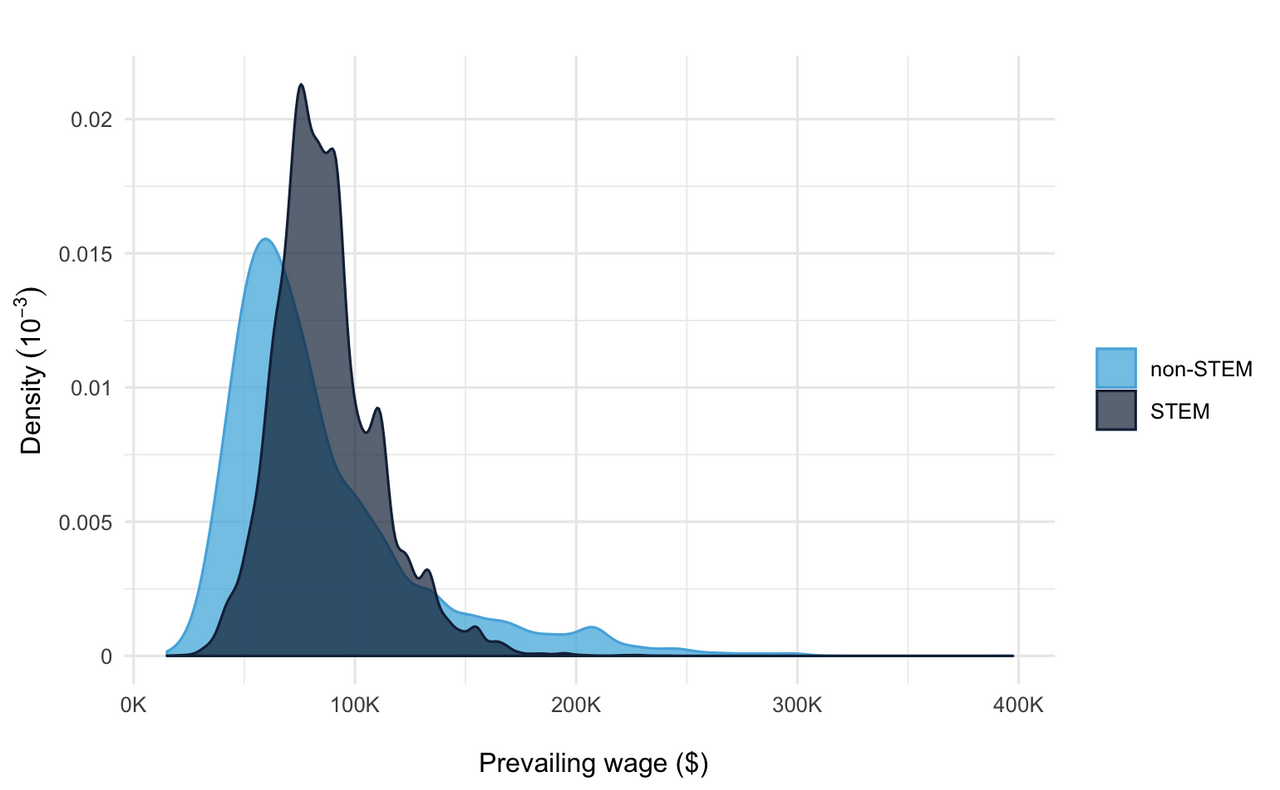
It is visible from the density plot of the wage distribution of the year 2018 that the wages of the STEM jobs in 2018 are not only higher but the distribution is also tighter as compared to the distribution for the non-STEM jobs.
Top Jobs In STEM in 2018
What naturally followed after this was an analysis of what these STEM jobs were, to gain an understanding of why so many foreign students were attracted to them (Figure 5). Software developer and software engineer positions seem to be the top two jobs with the highest number of applications. This might be attributed to the tech boom of the last 5 years, which greatly increased the demand for software developers.
Following closely behind are business analyst and programmer analyst positions. It is important to note that approximately 10 out of these 20 jobs could be associated with data-related jobs. Even if they were not explicitly listed as data-related jobs, their job descriptions include data-related responsibilities.
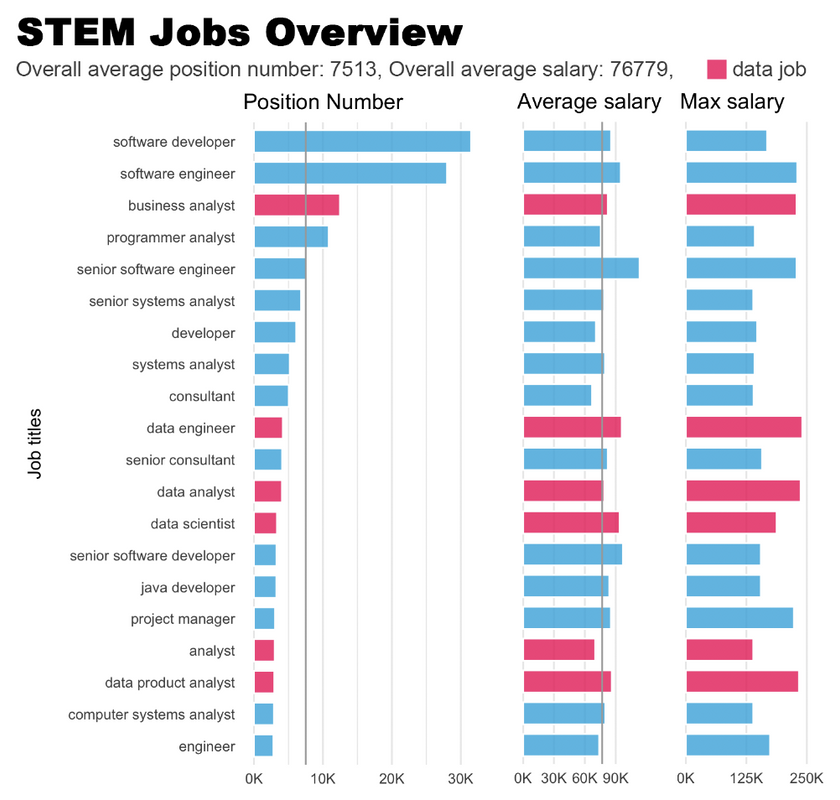
After recognizing the number of data-related jobs within the top 20 job titles in the last year, the next step was to break down what these data-related roles were and if we could combine them and/or break them down based on how complex we wanted our analysis to be.
Data-Related Job Trends
We created four categories of data-related jobs for this analysis. This categorization was based on the keywords in the job titles.
| Data Job Title | Associated Keywords |
|---|---|
| Business Analyst | “Business Intelligence” |
| Data Analyst | “EDA”, “Visualization”, “Data aggregation” |
| Data Scientist | “Machine learning”, “Model”, “Algorithm”, “A/B testing” |
| Data Engineer | “Pipeline”, “Data lake”, “ETL”, “Database”, “Warehouse” |
We combined machine learning and deep learning jobs into data science jobs, as they are highly correlated and it also made the following visualizations easier to look at. Since these data points were essentially just combined with another category, we need to note that the number of machine learning/deep learning jobs (with those explicit keywords as titles) has remained very few.
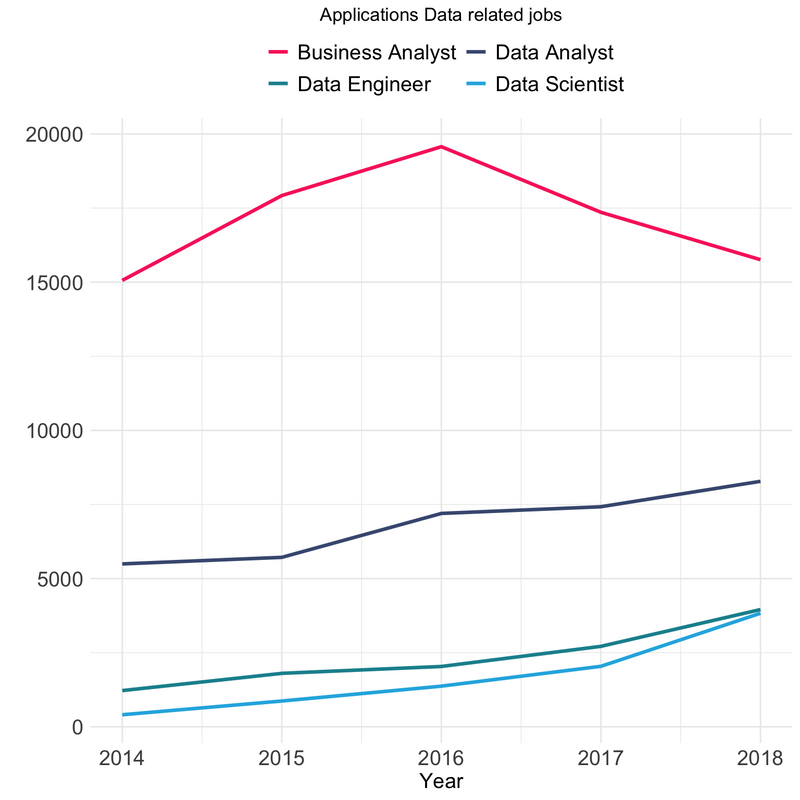
Two important things to notice here (Figure 6). Firstly, the total number of jobs for business analysts is much higher than the total number of jobs for other roles. There also seems to be a downward trend in the number of jobs for business analysts after 2016; however, the number of jobs within business analytics remains much higher than the number of jobs in any of the other categories in any of the years. Secondly, the number of jobs for data scientists, analysts and engineers is showing an upward trend. There appears to be a higher number of jobs for data analysts as compared to data scientists and data engineers. A reason for this is that the role of data scientists only emerged recently and the number of jobs available in the industry has just recently, in the past couple of years, started growing.
Prevailing Wages Per Data-Related Job Category
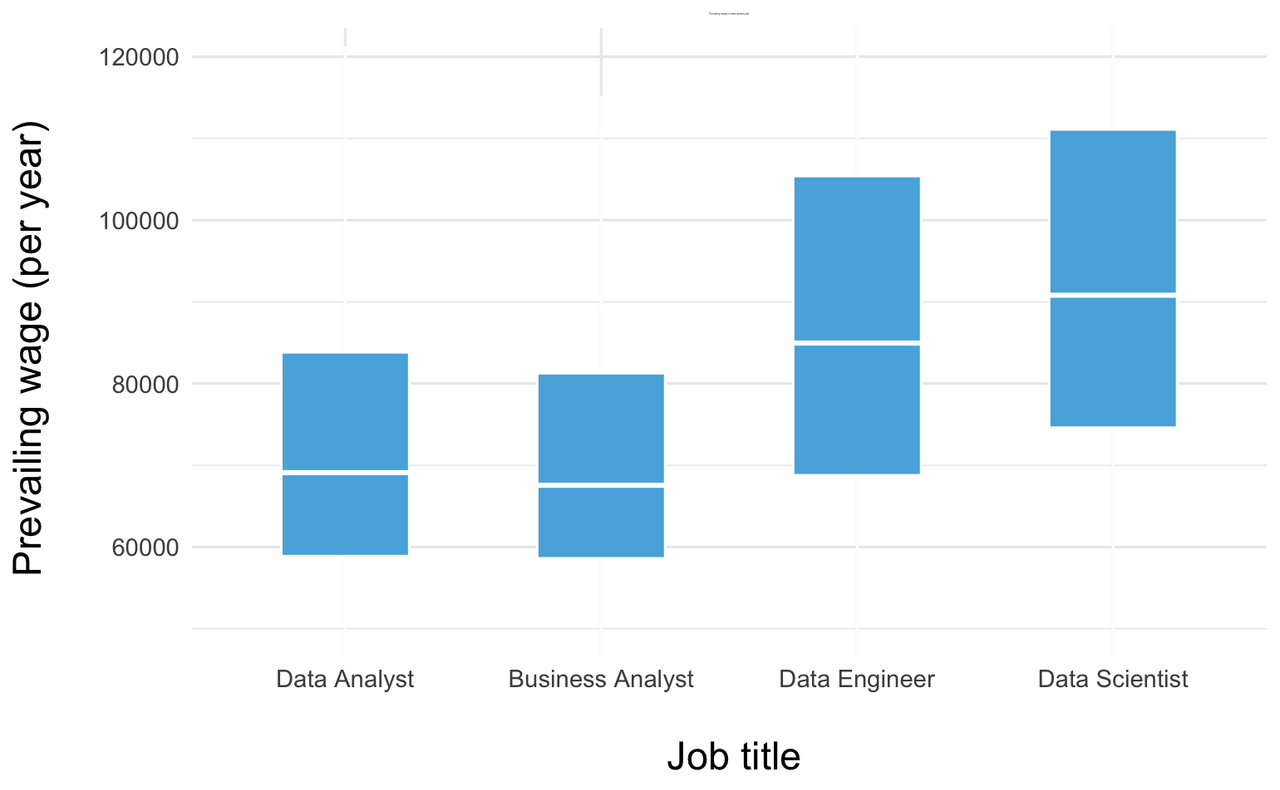
From the prevailing wages for the different categories that we established, we see that the median salary (from Figure 7) for a data scientist is much higher than the median salary for a business analyst. This coincides with our earlier analysis, where we saw that the number of H1B applications is much higher for business analyst roles than for data scientist or analyst roles. The higher number of jobs and lower salaries make business analyst roles a good opportunity for someone in data science to enter the industry.
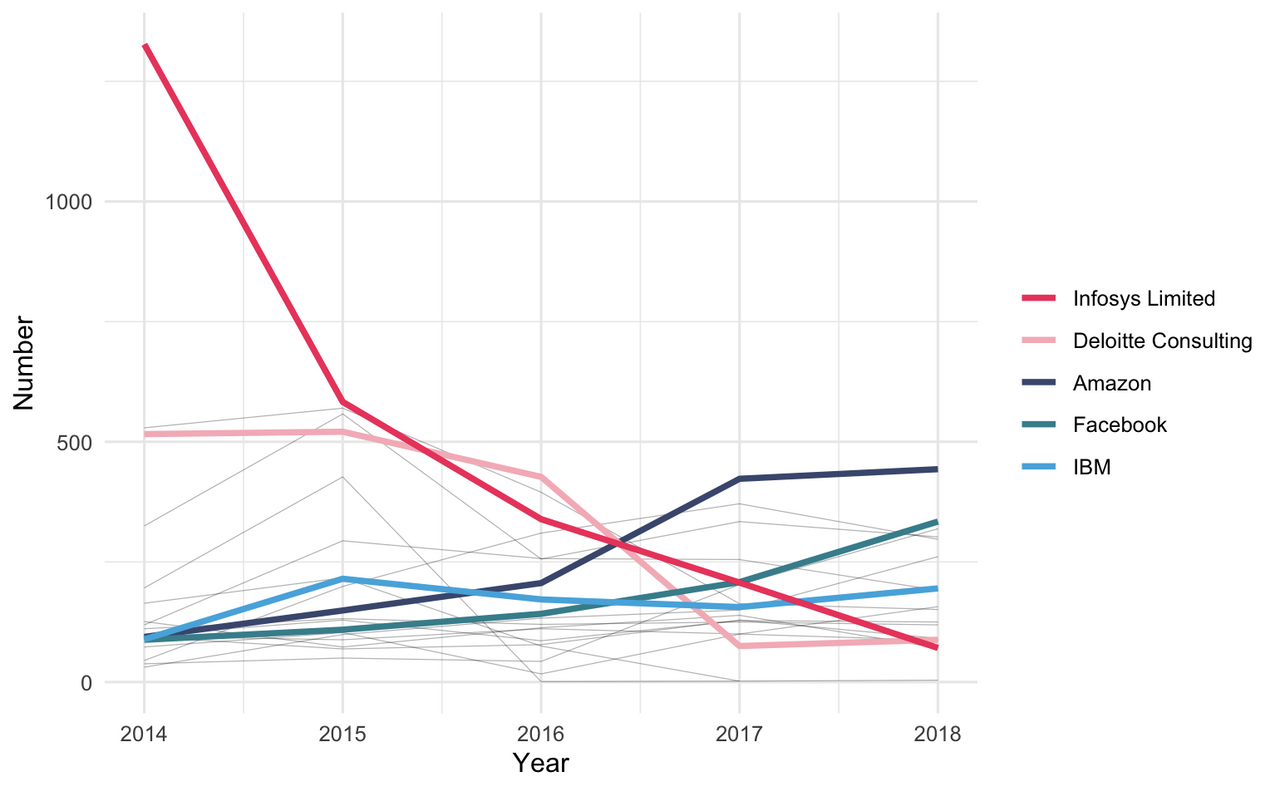
To get a general trend of what was going on in the industry for data-related roles, we looked at five companies with the highest number of applications from 2014 to 2017 (Fig. 8). We notice that although we expected the highest number of applications to come from tech companies, it actually comes from three consulting firms and two tech companies.
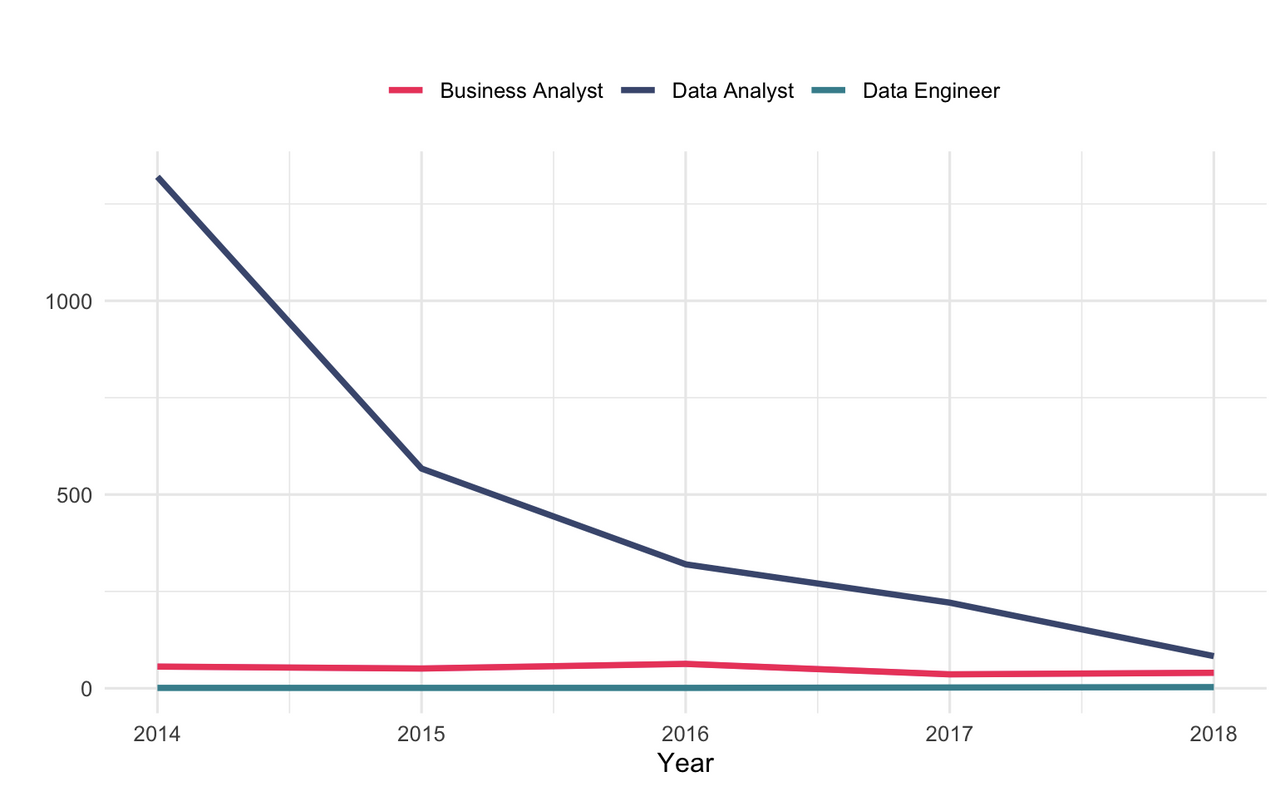
Infosys showed a very steep downward trend and also had the highest number of H1B applications in 2014, on a completely different scale compared with other similar companies (Fig. 9). This drew our attention because it was a highly abnormal trend, but upon deeper examination, it revealed a precautionary tale for foreign students trying to get jobs in the United States.
Story Behind Infosys
In 2013, Infosys agreed to pay $34 million to settle allegations that it was involved in fraud and abuse of the immigration process in the United States. Infosys brought foreign nationals into the country on visa types that are not authorized for employment in the United States. This means that the company was involved in fraudulent activity. USCIS has been stricter on companies like Infosys, Wipro, and Tata because they have a history of trying to work around the system and abusing it to employ cheap labor. The denial rate for these companies has been extremely high and appears to have effectively reduced the total number of applications submitted through them over the course of the last 5 years.
Top Tech Companies
A natural assumption for someone entering the market as a data scientist would be that the top tech companies have the highest number of jobs for data-related roles. We examine the top tech giants below.
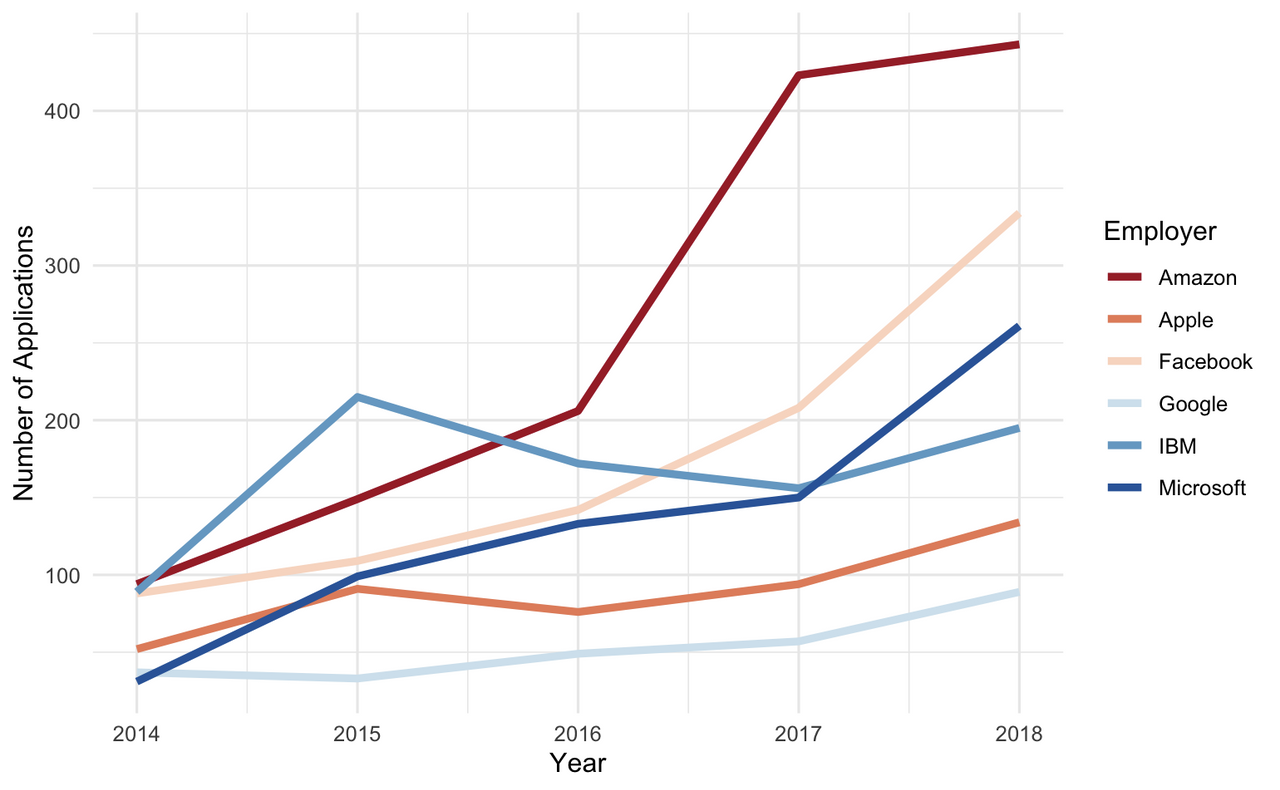
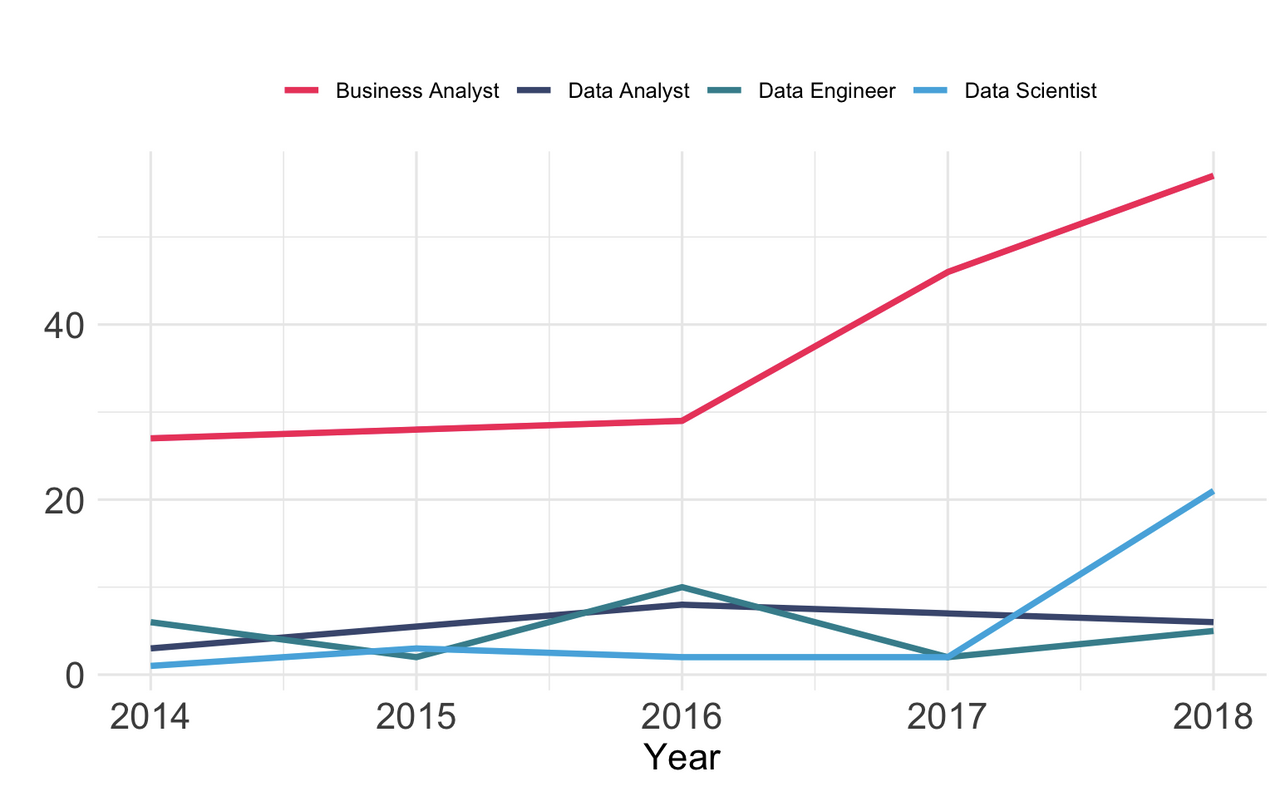
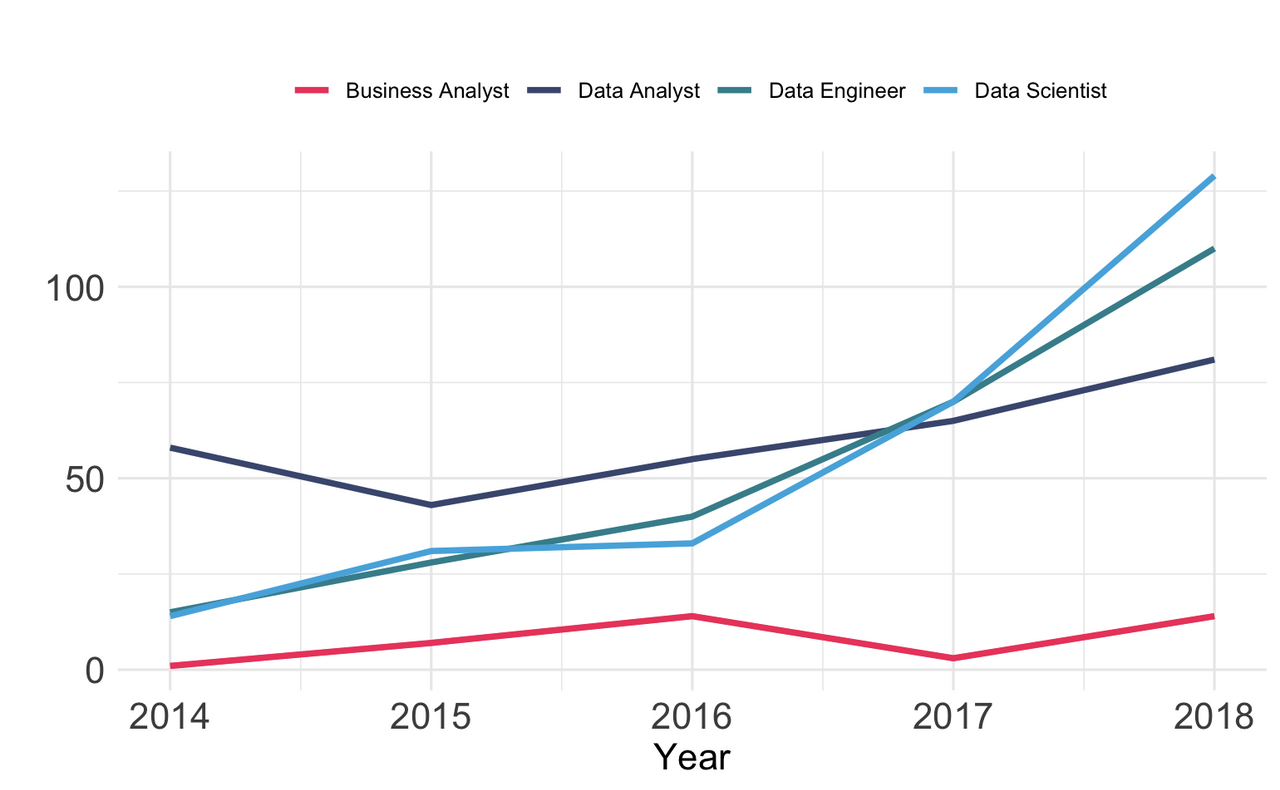
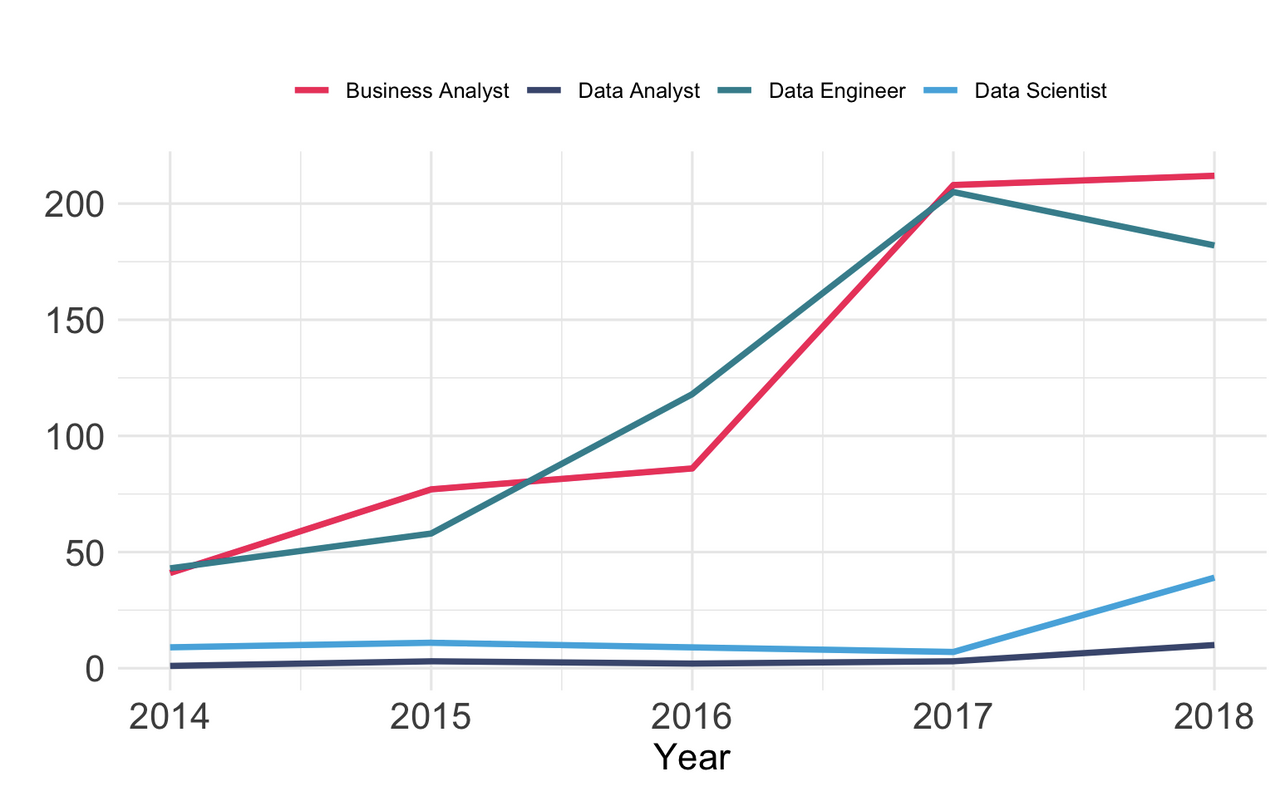
There is a general upward trend to the number of data-related jobs for all tech companies, with Google hiring the least number of people within data-related capacities and Amazon hiring the most. While most companies are showing an upward trend, IBM shows a decreasing trend from 2015 to 2017.
 |
 |
| a) Microsoft | b) Google |
 |
 |
| c) Facebook | d) Amazon |
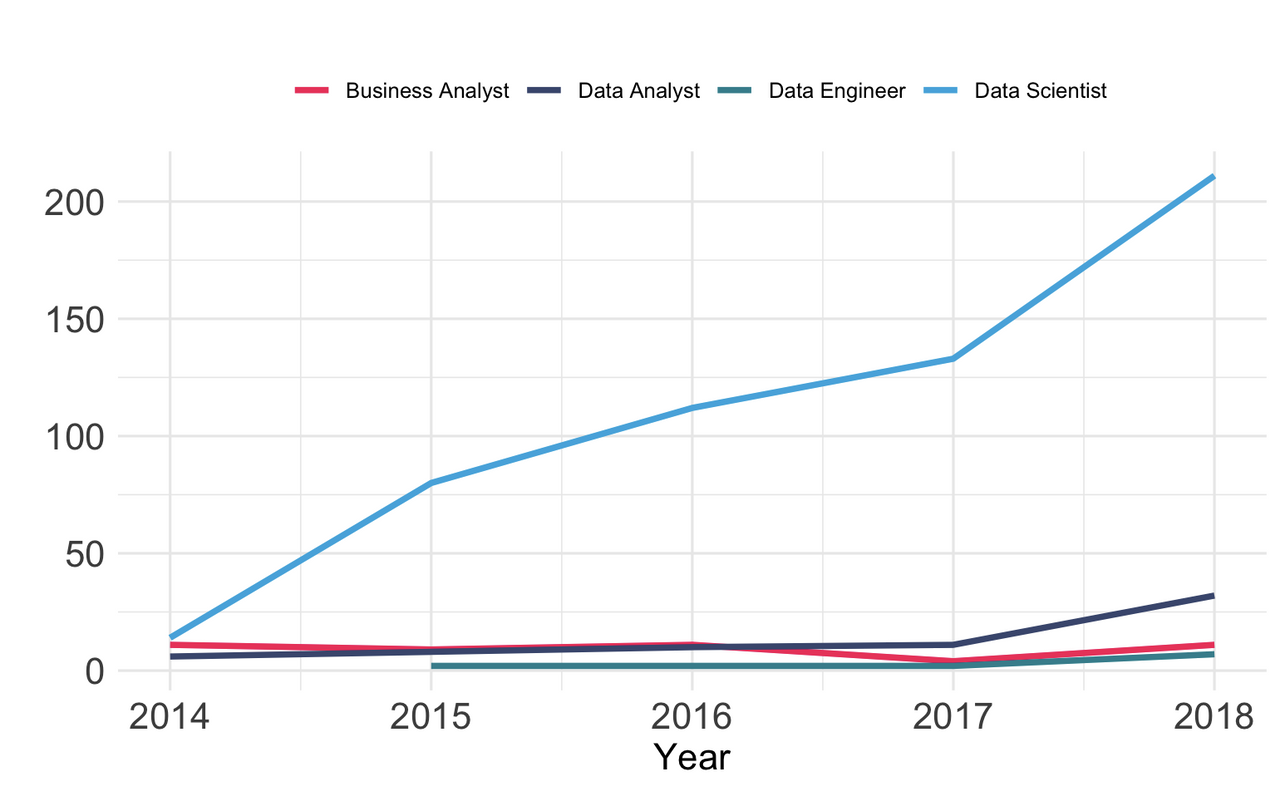
Figure 11: Trends in data-related roles at some of the top tech companies
All of the tech companies show an increasing trend in data-related roles. However, there are two companies that draw our attention. Google (Fig 11 (b)) has a much lower number of data-related jobs compared with the other companies. This might be attributed to the fact that some jobs may have data-related responsibilities even if they do not have data-related titles. But overall, Google has very few explicit data roles and thus fewer opportunities for international students.
Another trend of interest is Amazon (Fig 11 (d)), which sees a decrease in the number of applications for data-related roles after 2017. This might be attributed to stricter H1B regulations implemented under Trump’s administration, and it could also be related to job titles not fully reflecting data science responsibilities.
IBM
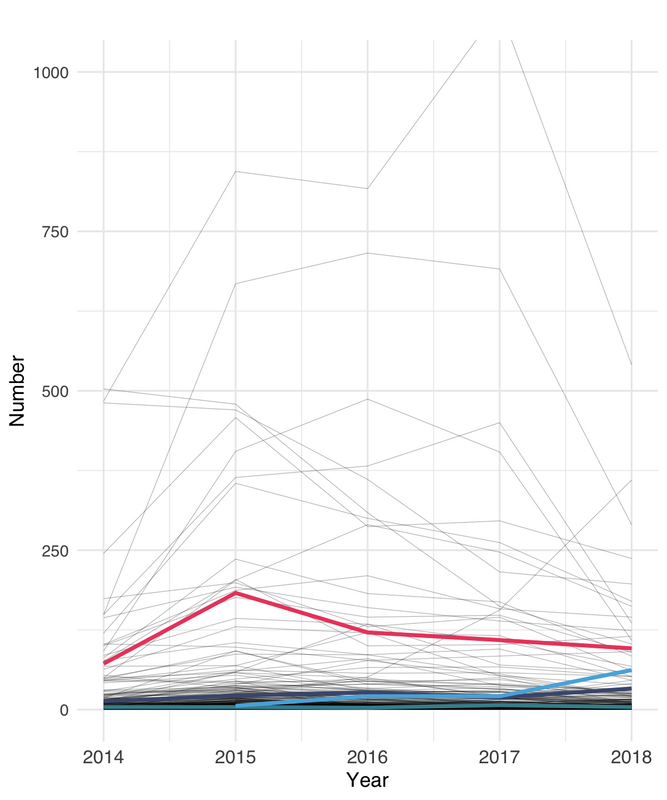
IBM H1B petitions see an overall decrease after 2017 (Fig 12 (a)). This is because Trump’s administration affected H1B denial rates. We can see that IBM has an increasing denial rate unlike those of tech firms. This can be attributed to the fact that IBM is not a traditional tech firm; it provides a lot of consulting services. Due to stricter review, the H1B application process involves providing more information about the exact type of work a company is involved in, the projects, and the subcontractors. This hinders non-tech companies from hiring more international students because it is both expensive and cumbersome. These companies would rather hire US citizens with the same skills if they can avoid it, and most of the time, a foreign employee can be replaced with a US citizen.
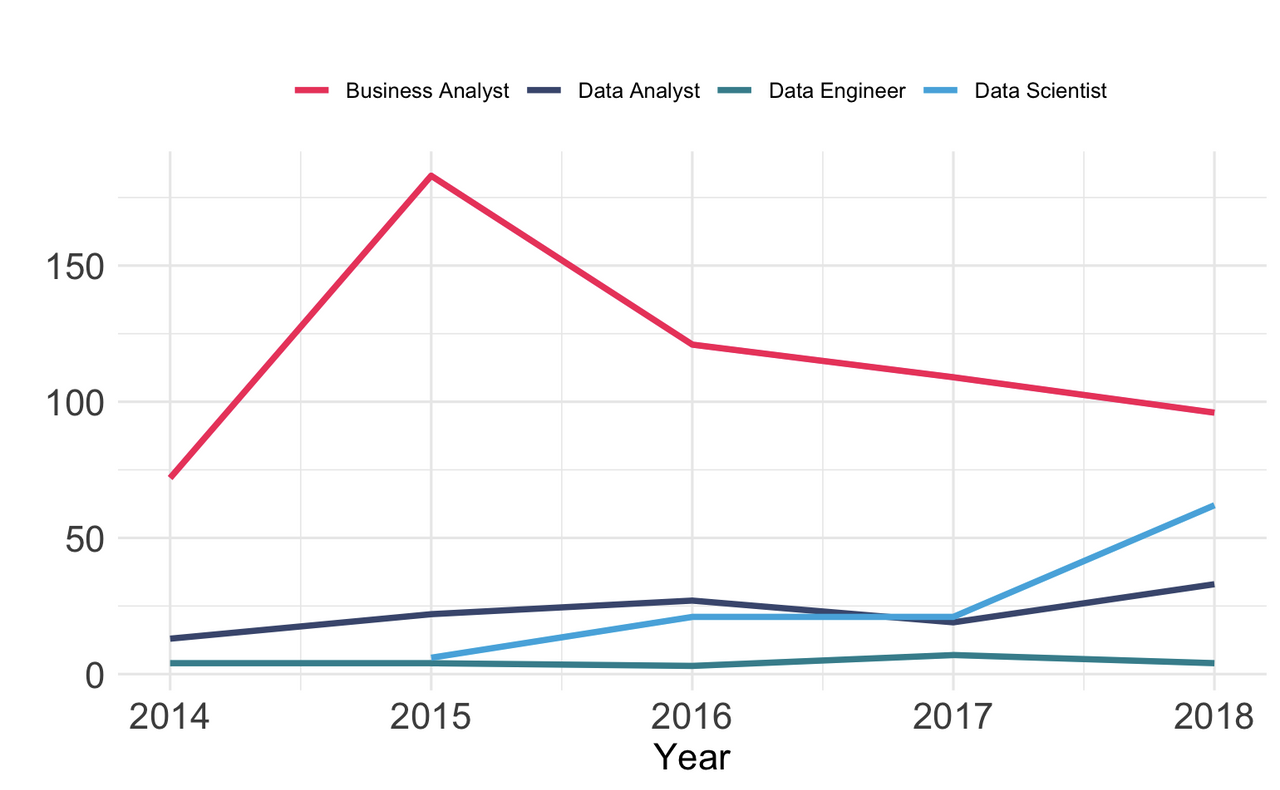
This downward trend is probably linked to IBM’s consulting sector combined with stricter government regulations. Despite this trend, the number of applications for specific data-related roles in IBM (Fig 12 (b)) seems to be unaffected by the broader downward trend.
Other Consulting Companies
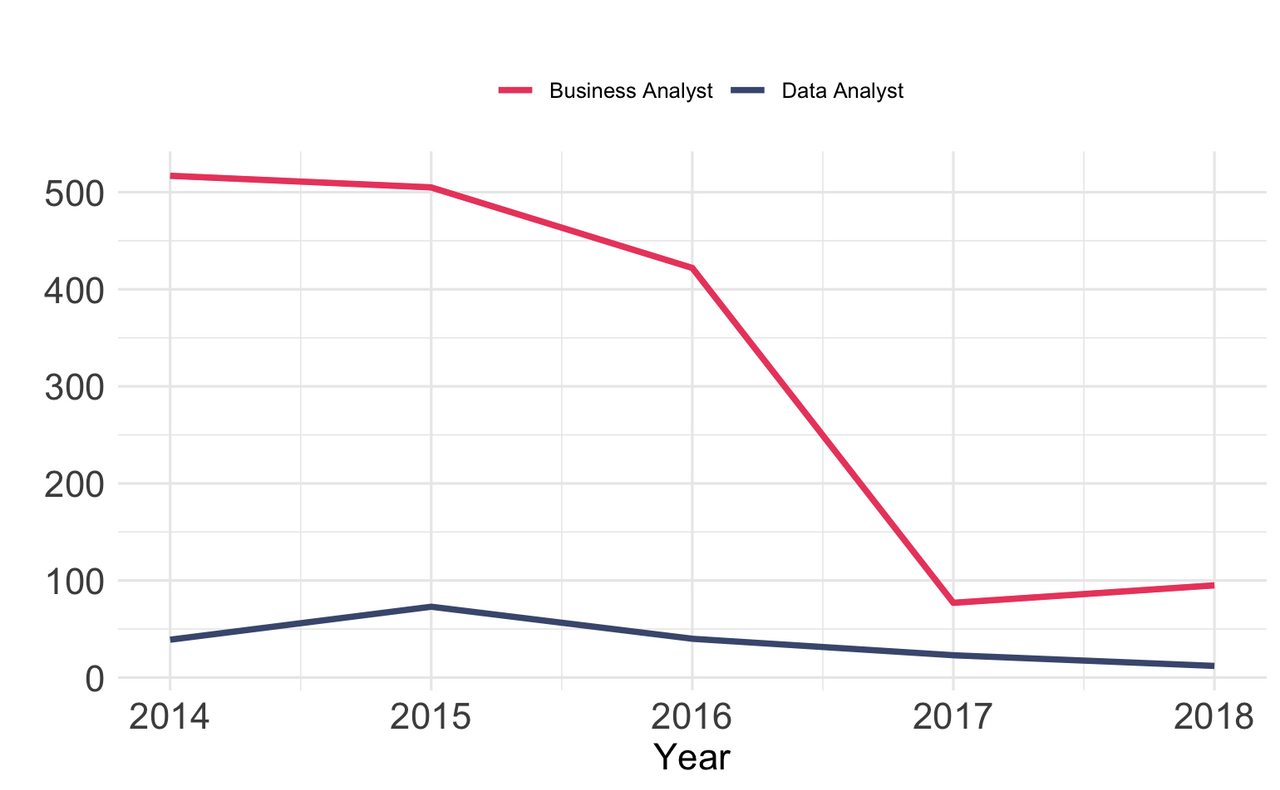
It would make sense that other consulting or non-tech companies should show trends similar to IBM, with a decreasing number of applications. This can be seen in both Deloitte and Accenture (Fig. 13 (a) and (b)). Even though Deloitte has been a major employer for data-related roles in the past 5 years, it has shown a sharp decrease in these roles after 2016 (Fig 13 (a)). This decline started before President Trump’s election, around 2015, when stricter regulations were implemented on working offsite while on H1B.
 |
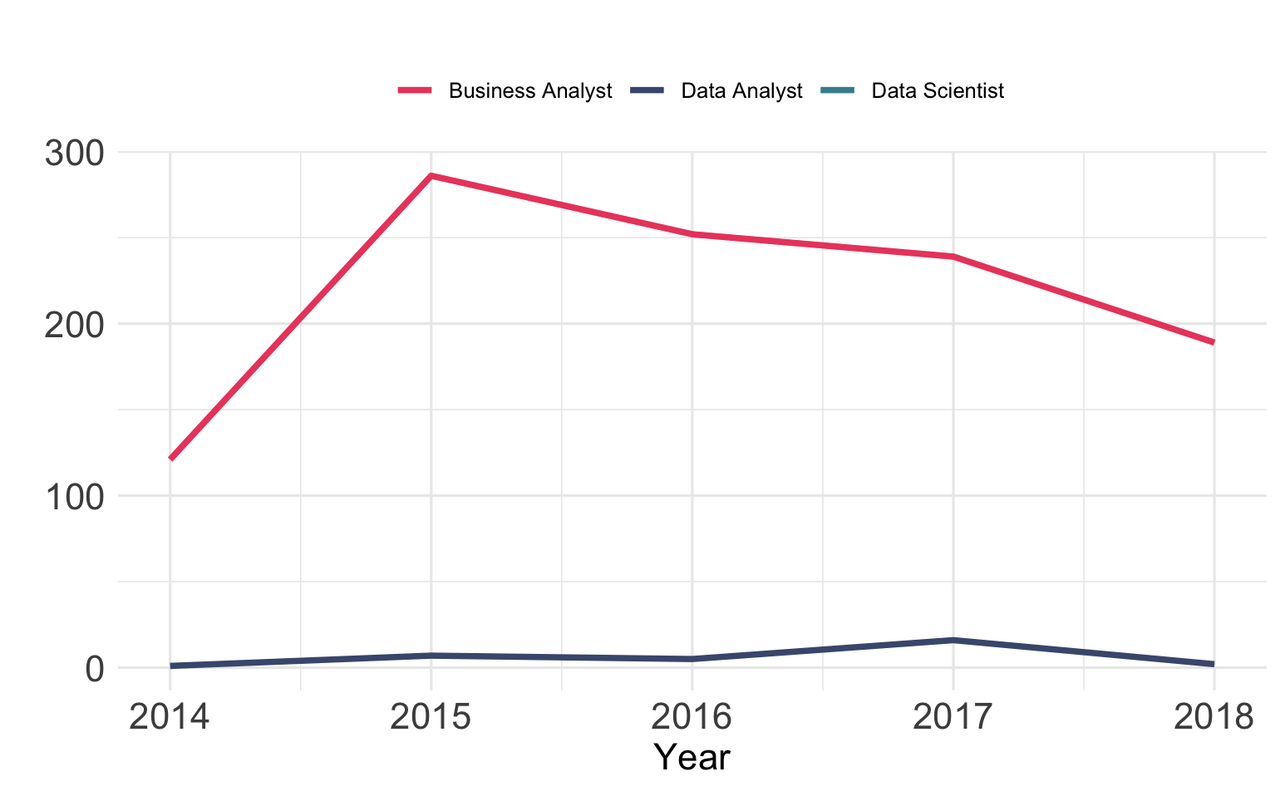 |
| a) Deloitte Consulting | b) Accenture Consulting |
Figure 13: Consulting companies and the trends in data-related roles
The worksite regulations implemented in 2015 can cause problems for consulting companies as a lot of consulting work may be off-site in another city and not in the official workplace. Also, consulting companies that deal with the U.S. Federal Government might not hire international students as the work might require the workers to be U.S. citizens.
Locations for Data-Related Jobs
Nationwide Overview
This is an incomplete but interesting cartographic analysis (Fig. 14). The first thing we can see, however, is that the largest number of applications in data-related roles is coming from (starting from the West Coast to the East) Washington, California, Texas, Illinois, Georgia, Florida, New York, New Jersey, and Massachusetts.
Just because the colors seem similar for certain states in this diagram does not mean that the numbers of data-related H1B applications are the same. They belong to the same interval or are above a certain threshold. The numbers for the major states are as follows:
- California - 7,417 applications
- New York - 2,516 applications
- Washington - 1,428 applications
- Texas - 2,499 applications
- New Jersey - 2,007 applications
- Massachusetts - 1,570 applications
Wyoming and Montana have 2 and 5 H1B applications, respectively, in 2018. This indicates that these would be the worst states to apply for data-related jobs.
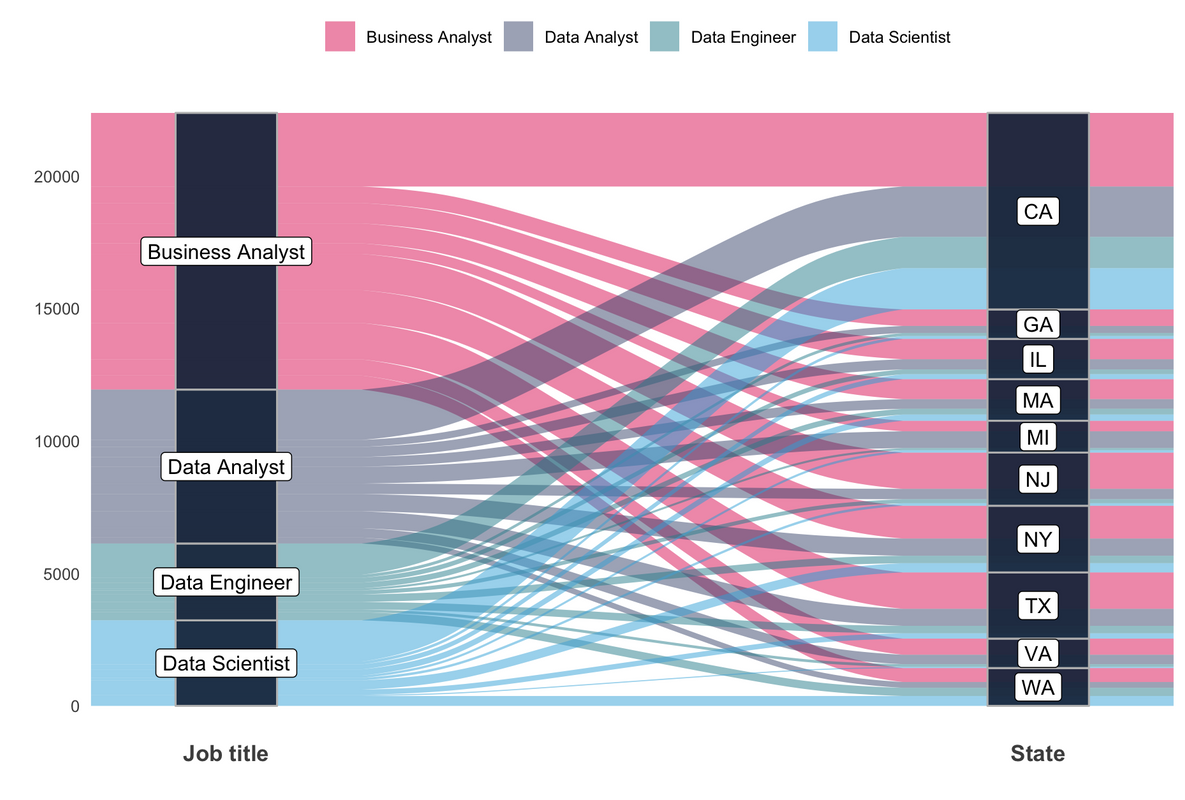
Upon taking a deeper look at the different jobs and the top states for those jobs, we can see how the number of applications for data-related roles is distributed among the top states. What is interesting to note here is that the Business Analyst role is more common in almost all states except Michigan, where Data Analyst applications are higher than Business Analyst applications. We can see that the majority of Data Scientist applications are coming from California, while Washington and New York follow right after.
Regions of the United States
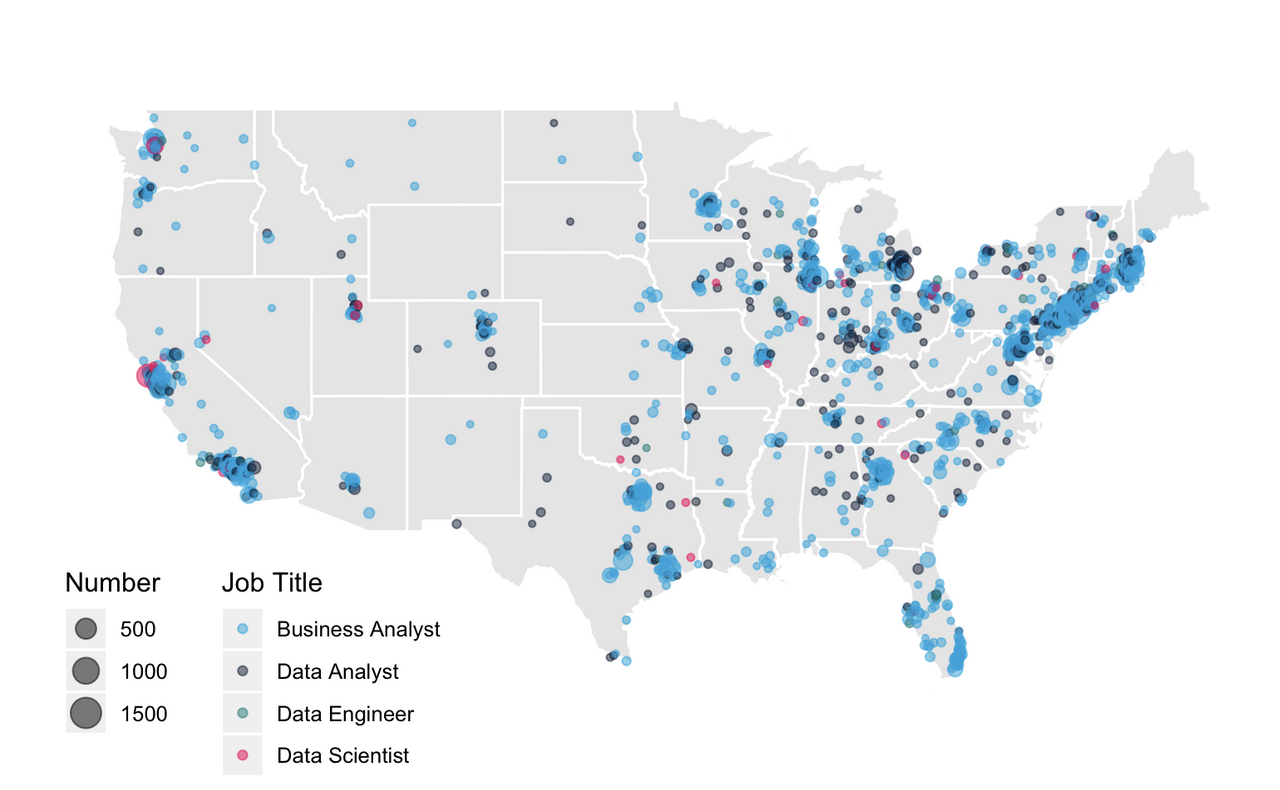 Figure 16: 1 Point = 1 City. Color = Data position with the highest number of jobs in that city
To find where it would be best to apply based on the type of data role, a deeper analysis is needed into which cities are best, based on the proportion of jobs available for each data role. In Figure 16, each point is a city, and the color of the city is determined by which data position accounted for the majority of applications in 2017 and 2018. Using two years for the analysis instead of one is better because it provides a clearer picture of data-related jobs. We can see many blue clusters forming on the East Coast, some black clusters forming in Michigan, and a greater variety of colors in California, the Bay Area, and Washington.
The Western United States
The Western United States has two main states of interest for data-related roles, Washington and California.
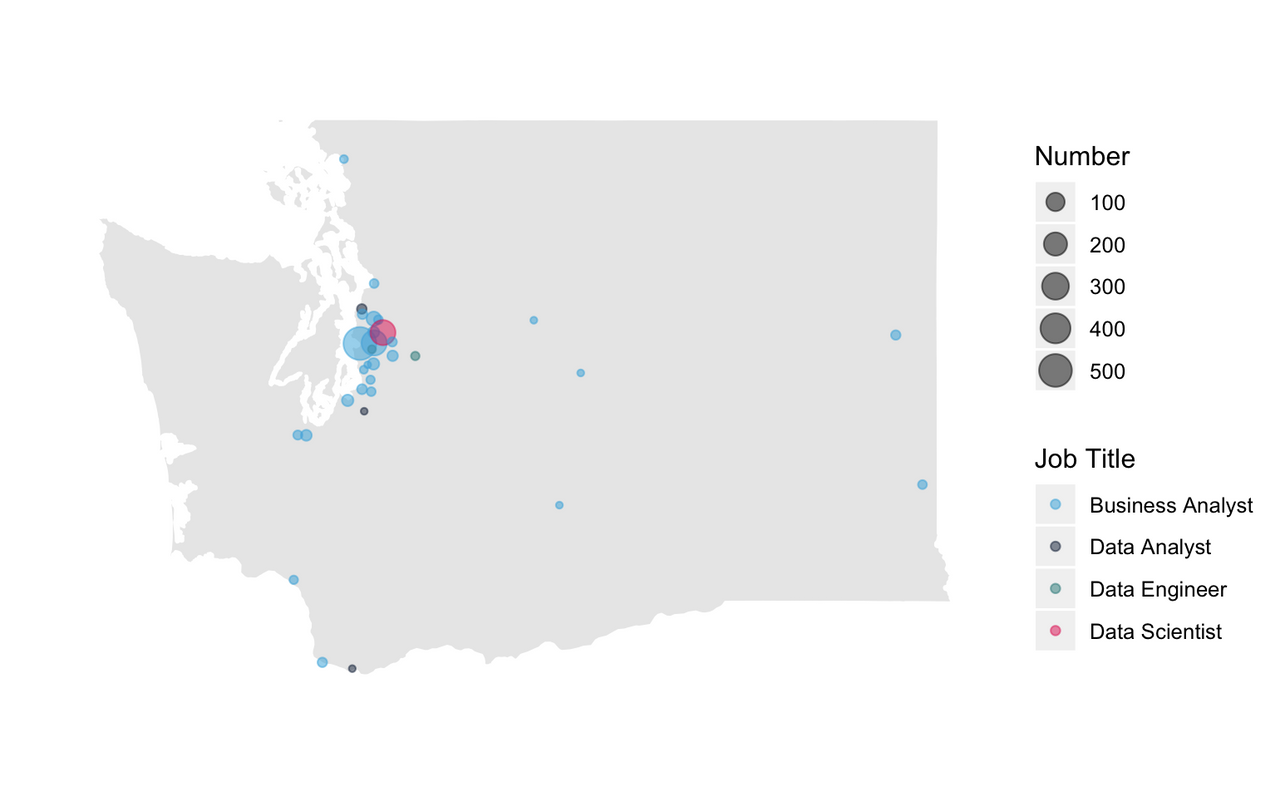
Washington has a significant number of data-related roles, with Seattle having a majority of Business Analyst applications and Redmond (red circle) having a higher number of data scientists. This may be because Amazon and Microsoft headquarters are located in Seattle and Redmond.
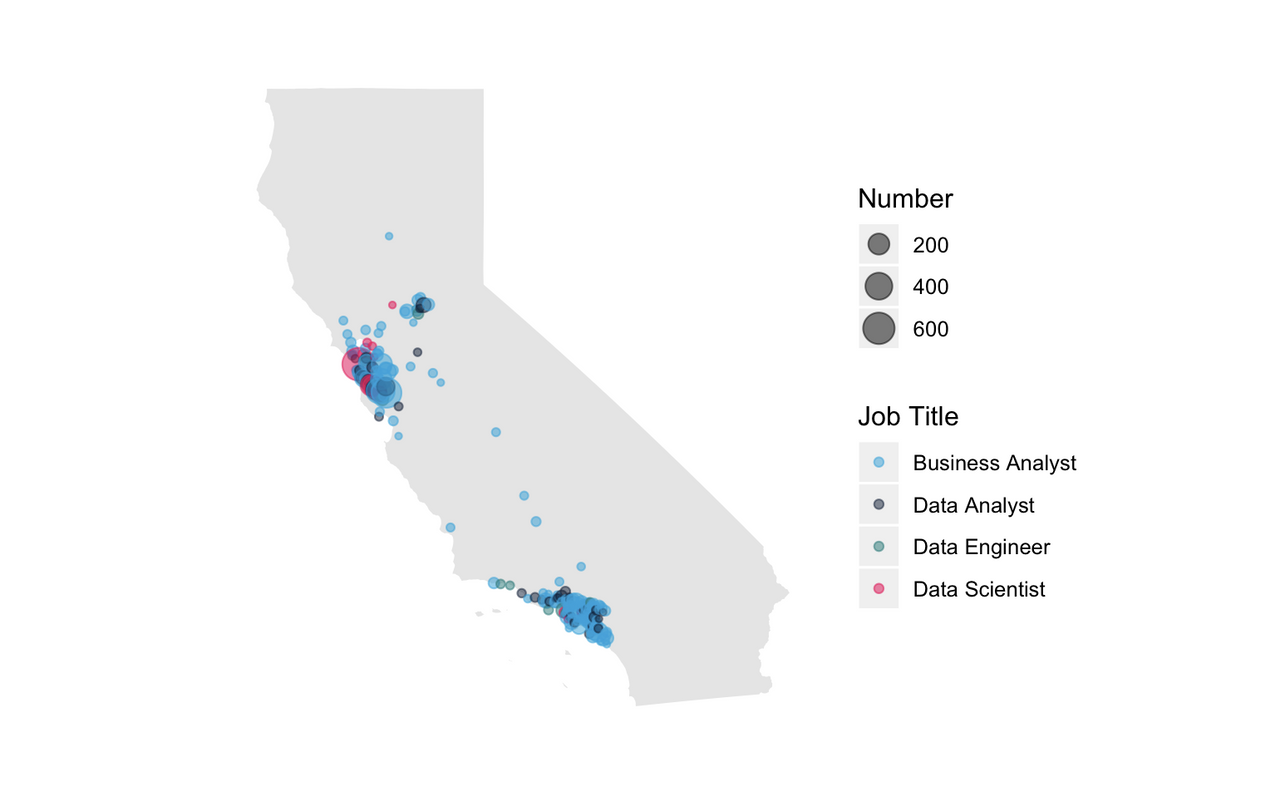
If someone is pursuing a data scientist role or job title, the state of California seems to have the most variety and also the highest number of H1B applications for that role (668 H1B applications). The big red circles show that a large number of data scientists applied for H1B from the Bay Area (San Jose, San Francisco, and Oakland). This makes complete sense because of the presence of Silicon Valley, where many tech company headquarters are located, and the recent boom in data science jobs in the tech industry.
The Northeastern United States
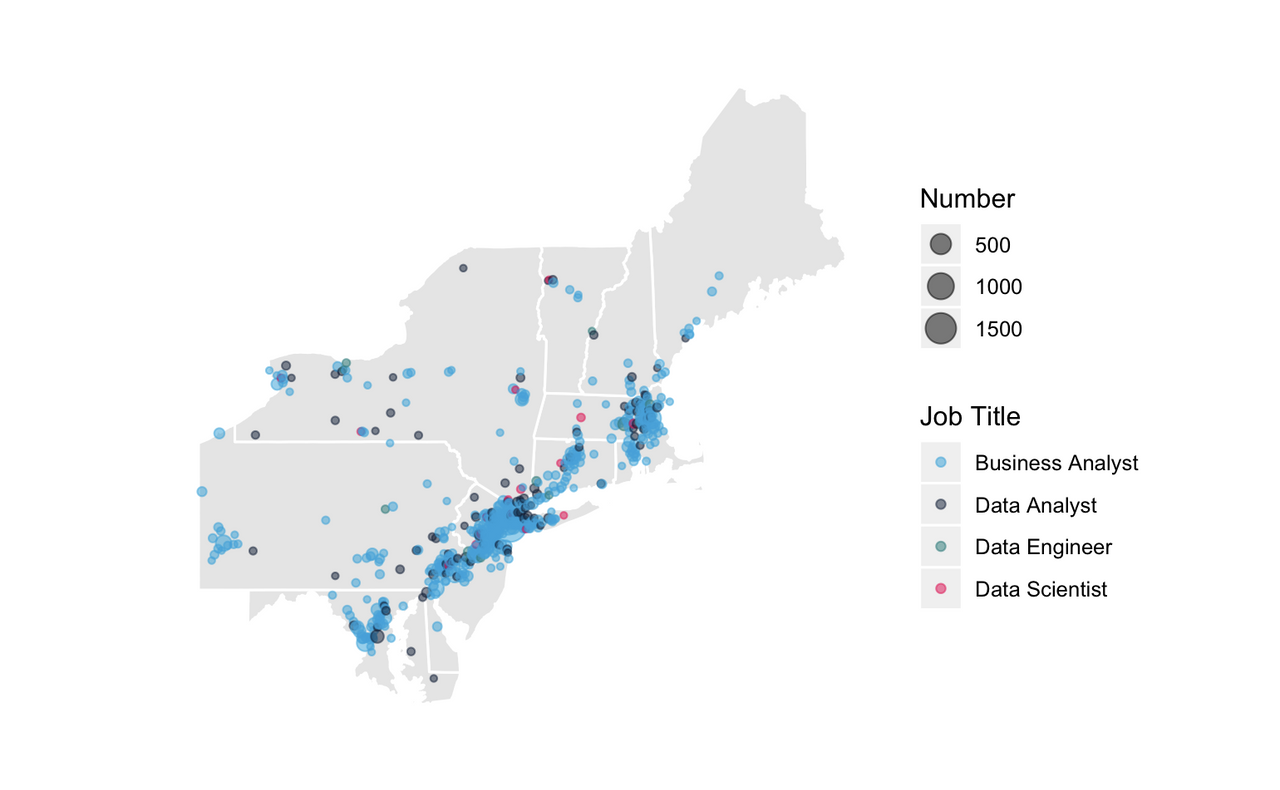
We see four main clusters on this map: Boston, New York, Philadelphia, and Washington DC. The majority of these clusters are blue, as the Northeast has a relatively large number of finance and insurance companies (+22.7% compared with other places in the United States), and these companies have a large number of business analyst or data analytics positions compared with other roles. The existence of some black clusters is an indication that this industry requires data analysts.
The Midwestern United States
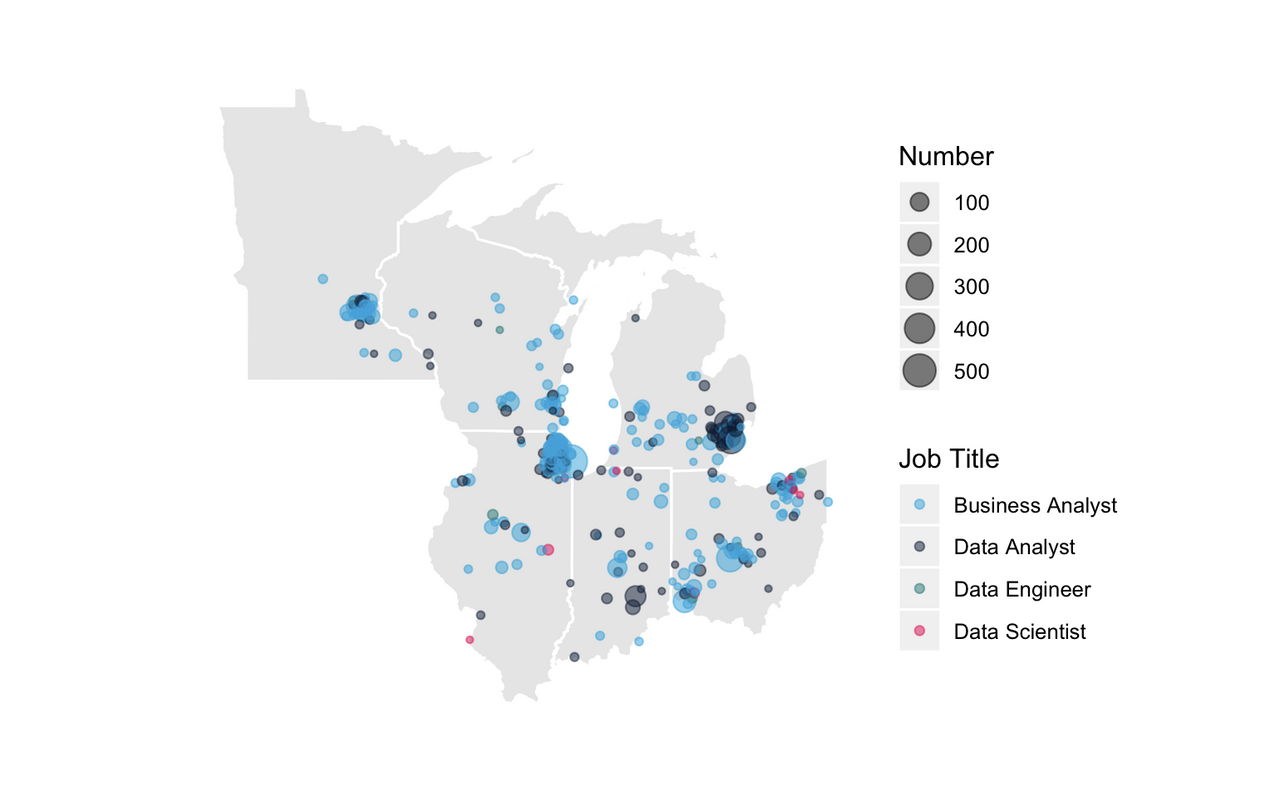
The Midwest shows relatively more black clusters compared with any other region. There is a large black cluster in Michigan, indicating a significant number of data analyst positions in Detroit, and a large blue cluster in Chicago, indicating a large number of business analyst positions.
State of Tennessee
The final and most important analysis, relevant to the authors of this paper and the potential individuals reading it, is an analysis of the data-related job market for international students using H1B in the state of Tennessee.
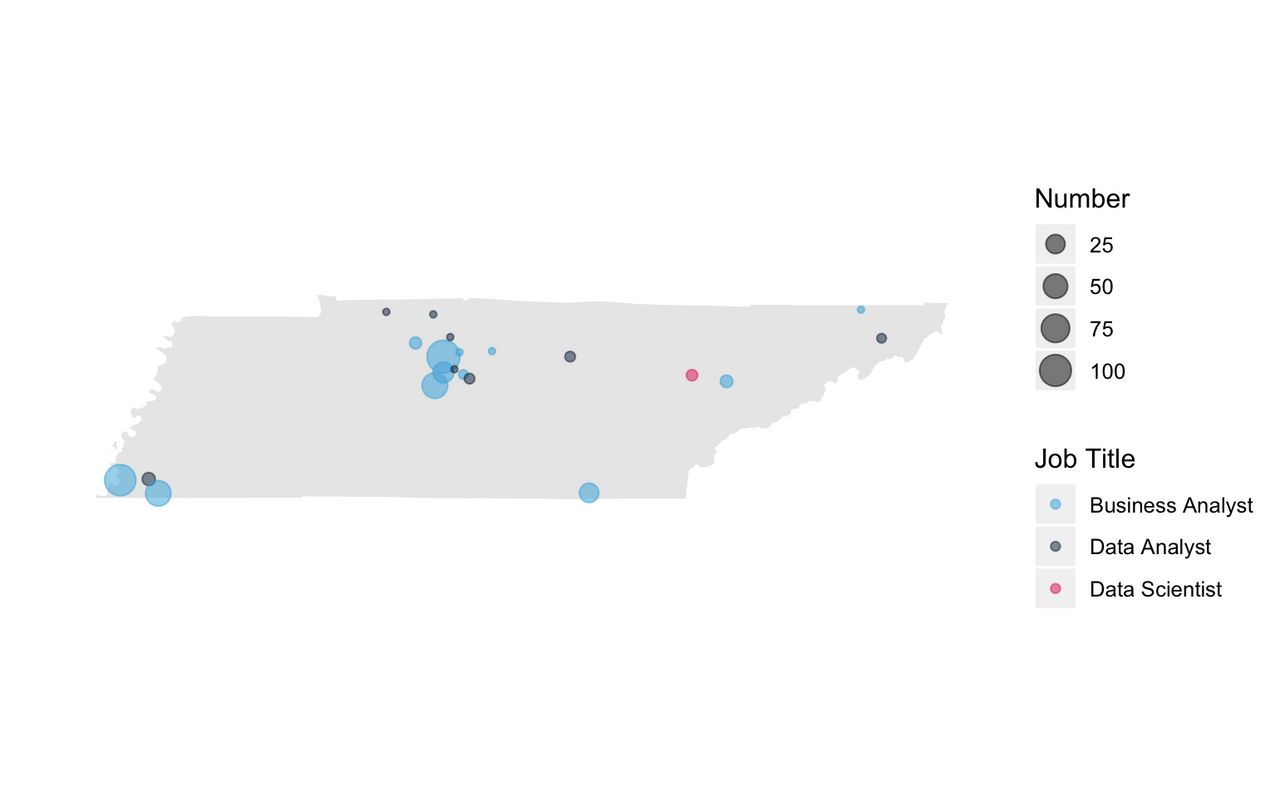
There are two major cities where we find the biggest clusters for data-related roles: Nashville and Memphis. Both of these cities have applications mainly for business analytics. We can see a small number of data analyst roles in other parts of the state, with one small dot representing data science applications around the Oak Ridge area. This is from an employer named Oak Ridge National Laboratory, which hires data scientists for its work and research.
This does not make Tennessee the best state for foreign students who are pursuing data science; however, growth in data science jobs is projected over the next few years, due to tech companies moving to Tennessee.
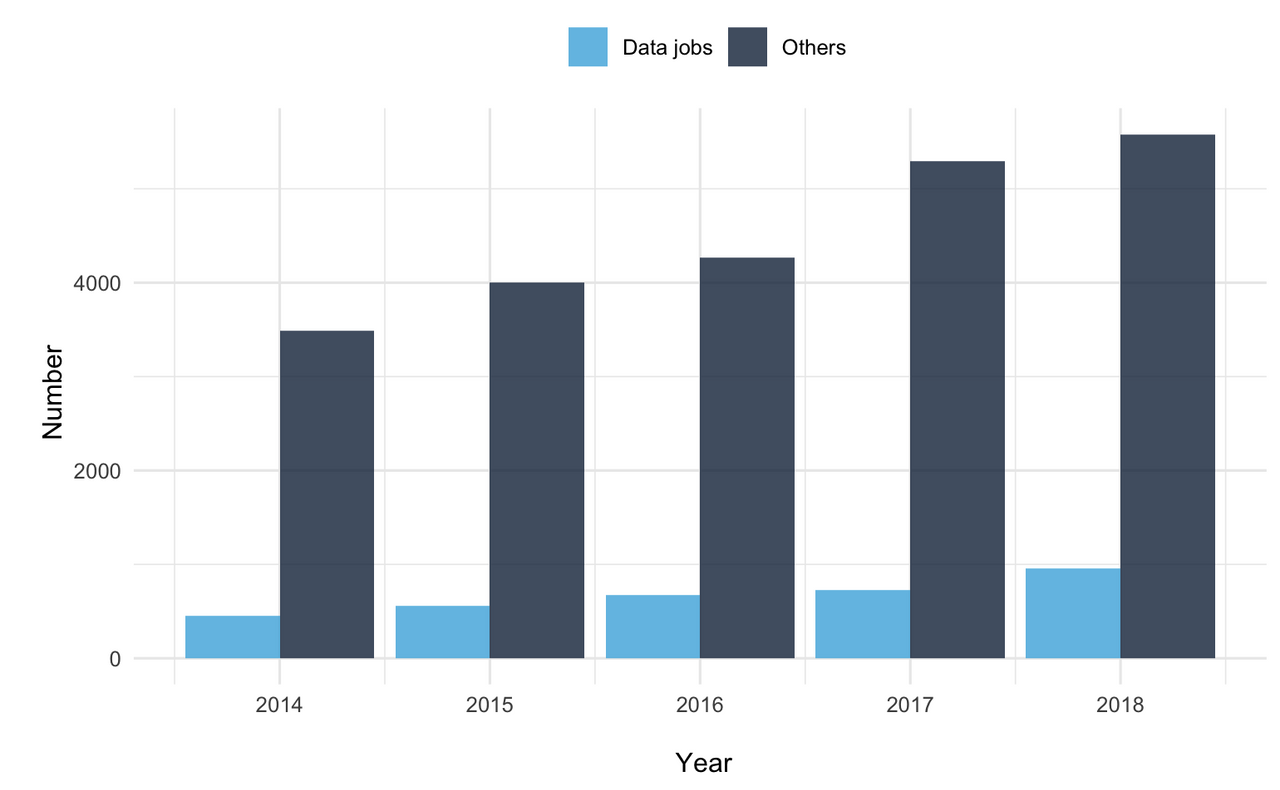
Figure 13 shows that there has been growth in data-related roles in the past 5 years, with 2018 showing the highest number of applications for data-related roles. This is promising, as it may mean a higher number of data-related roles for which employers will hire and sponsor international students in the years to come.
Conclusions
To reiterate, the purpose of this data exploration was to examine trends in H1B visa applications and see how data-related jobs in the United States have changed over the past 5 years. This analysis can be used to help international students pursuing a data-related degree determine what type of jobs they should apply for and where they should consider moving in the future if they want to stay within the United States.
We can gather from our analysis that among the four data-related job titles that we divided our dataset into (business analyst, data analyst, data engineer, and data scientist), the highest number of jobs is available for the business analyst job title or classification. We also note that the salary for this job role is much lower compared with the other data-related jobs. The barrier to entry for this specific role might be much lower compared with other roles. This is because there are many business analyst jobs, and potential employers may be more open to hiring data science students from business backgrounds, as they would be able to perform well in roles associated with business analytics.
In terms of what type of company data scientists should apply for, we find that some big companies such as Google and Apple (shown in the final-report.Rmd) have fewer data-related jobs for international students despite being major tech companies. However, there does seem to be an upward trend in data-related jobs in the tech industry.
We can also see that consulting companies are harder places to get data-related jobs, as they are more affected by governmental regulations and policies. These positions may be limited to U.S. citizens or permanent residents. It is also cheaper for these companies to hire domestic workers, as consulting roles are not as profitable as purely technical roles and therefore may not need extremely specialized foreign talent.
The location analysis will help international students pursuing a data-related degree find the most probable location they should move to based on the type of data-related role they want to pursue. The best location to find a job in business analytics is in the northeastern states, as they have a large number of finance and insurance companies. However, there is no shortage of business analytics roles, since these are very commonly found in almost every company. Almost every state has a large number of these roles. Nevertheless, it is still important to note that the total number of applications for H1B in business analytics is showing a generally downward trend.
The best location to find a job as a data analyst or in data analytics is the Northeast or the Midwest, as seen from the clusters in the maps that we explored. However, since a large number of job applications come from California, almost all of these roles are plentiful in the state of California. California is also where a large number of specific data scientist and data engineer roles are available, especially in the Bay Area, where many tech companies are located. The state of Washington (Seattle and Redmond area) is also good for finding data engineering and data science jobs because of the presence of Microsoft and Amazon.
Finally, although Tennessee is not the best for international students pursuing data-related roles, there does seem to be a potential for growth since tech giants such as Amazon and Microsoft are creating more opportunities for jobs in the Nashville area in the future.
Slides
Hint: Project GitHub page: H1B-visas-analysis