This project is a data visualization dashboard designed to help non-professional users explore the Latin American Public Opinion Project (LAPOP).
Due to copyright issues and confidentiality agreements, the dashboard is shown with randomly generated data based on the real data format.
How to use it?
- Select the countries and years you want to analyze (multiple choices) to obtain key figures and visualizations of the overall situation of the respondents.
- Select the topics and questions you want to analyze in detail, and obtain key figures, visualization results, and time-series visualizations for a single question.
- Select topics and questions for cross-analysis to get visual results for cross-analysis.
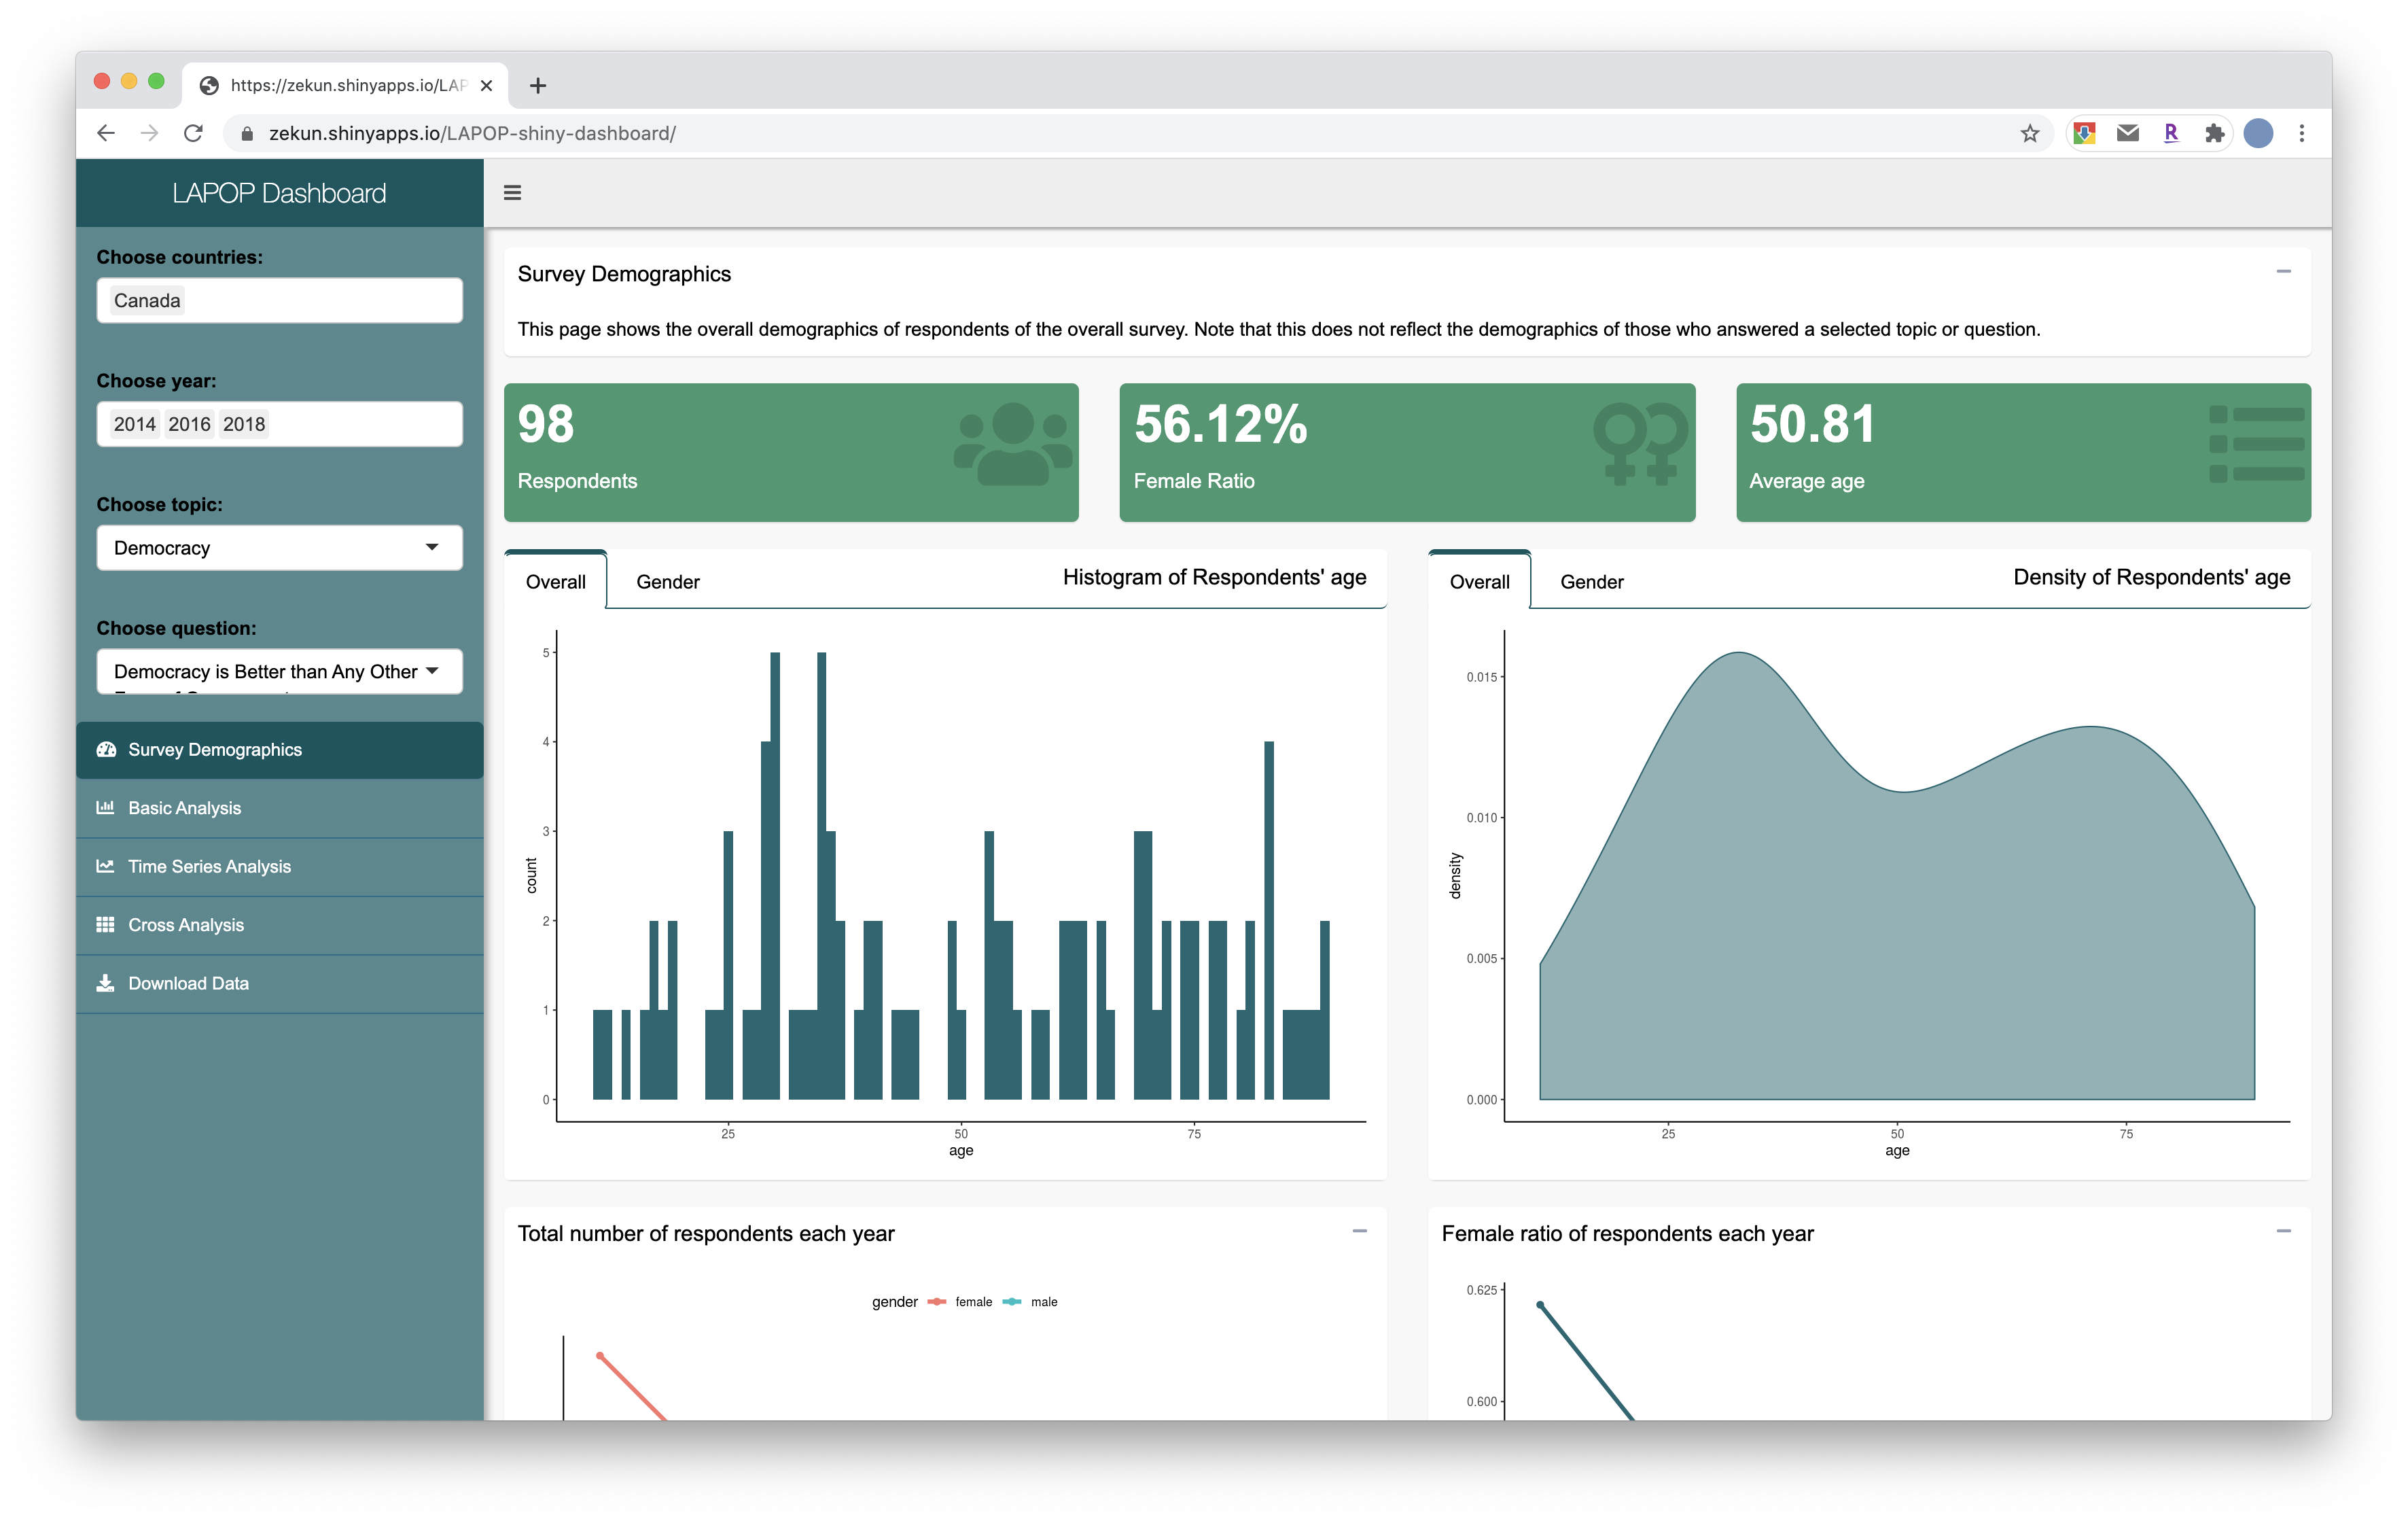
Click here to open the dashboard
Project GitHub page: LAPOP-shiny-dashboard